A normal quartile plot is given below for a sample of scores on an aptitude test. Use the plot to assess the
normality of scores on this test. Explain your reasoning. 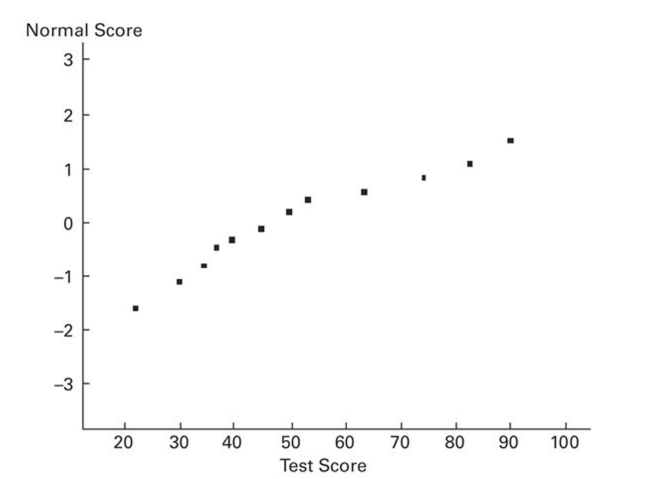
Correct Answer:
Verified
View Answer
Unlock this answer now
Get Access to more Verified Answers free of charge
Q38: Assume that the red blood cell
Q39: Find the indicated z score. The graph
Q40: Which of the following is a biased
Q41: Three randomly selected households are surveyed as
Q44: You will use a normal distribution
Q48: A normal quartile plot is given below
Q51: Describe what an unbiased estimator is and
Q56: Identify three important criteria to determine if
Q57: State the central limit theorem. Describe the
Q60: Lengths of pregnancies are normally distributed with
Unlock this Answer For Free Now!
View this answer and more for free by performing one of the following actions

Scan the QR code to install the App and get 2 free unlocks

Unlock quizzes for free by uploading documents