Find the area of the shaded region. The graph depicts the standard normal distribution with mean 0 and standard deviation 1. 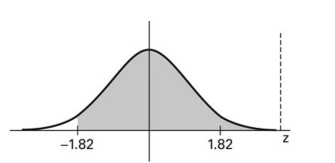
A) 0.4656
B) 0.0344
C) -0.0344
D) 0.9656
Correct Answer:
Verified
Q16: Estimate the indicated probability by using
Q17: Find the area of the shaded region.
Q18: The lengths of human pregnancies are normally
Q19: Assume that
Q20: For the binomial distribution with
Q22: An unbiased estimator is a statistic that
Q23: A baseball player has a batting average
Q24: Scores on a test are normally
Q25: In one region, the September energy consumption
Q26: A coin is tossed 20 times. A
Unlock this Answer For Free Now!
View this answer and more for free by performing one of the following actions

Scan the QR code to install the App and get 2 free unlocks

Unlock quizzes for free by uploading documents