
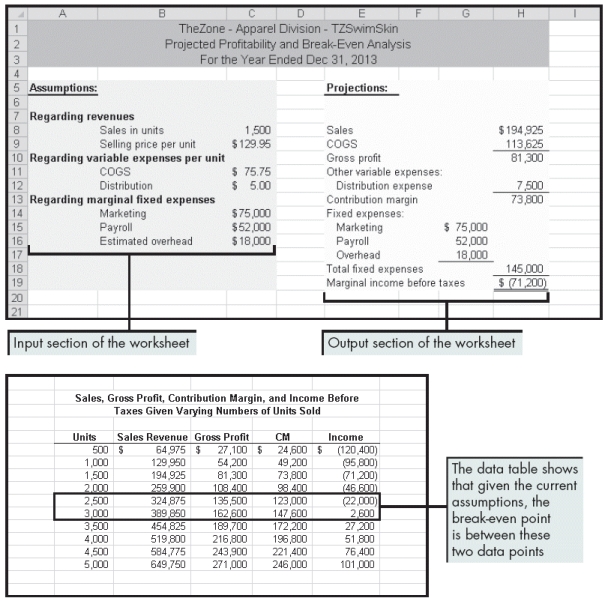
Beckham created the worksheets above to show the profitability and break-even points for his company. Please refer to the figure above as you answer the questions below.
-Beckham has received word from the Purchasing Department that there could be some variance in the COGS. He wants to develop a worksheet that shows the effects of various interactions between the selling price and the cost of goods sold per unit on profitability. In the two-variable data table, how would he set it up?
A) Place COGS and selling price next to each other in a column, and the table's output formula for income in the third column.
B) Place COGS and selling price perpendicular to each other, and the table's output formula for income in the intersection of these two sets of input variables.
C) Place income and selling price perpendicular to each other, and the table's output formula for COGS in the intersection of these two sets of input variables.
D) Place COGS and selling price in two subsequent rows, with the table's output formula for income in the third row.
Correct Answer:
Verified
Q109: The _ function generates a random number
Q110: A(n) _ table is a range of
Q111: Q112: When using data tables to run a Q113: Q115: In financial statistics, a probability distribution assigns Q116: _ analysis is a type of what-if Q117: The VLOOKUP function compares a lookup value Q118: _ is a process of changing values Q119: Unlock this Answer For Free Now! View this answer and more for free by performing one of the following actions Scan the QR code to install the App and get 2 free unlocks Unlock quizzes for free by uploading documents![]()
![]()
![]()

