A function shows constant percentage growth. Which of the following may be the graph of this function?
A) 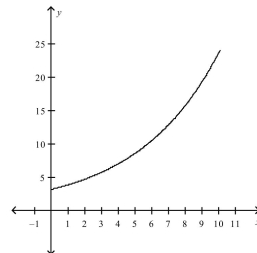
B) 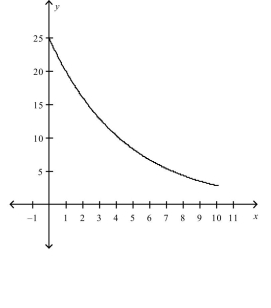
C) 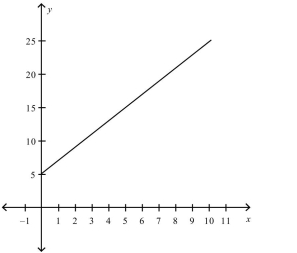
D) 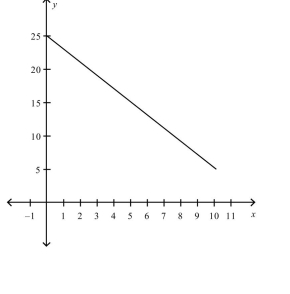
Correct Answer:
Verified
Q10: Find an exponential model for the
Q11: Use exponential regression to determine what
Q12: If a function decreases by 5% each
Q13: The monthly percentage decay rate for a
Q14: Find an exponential model for the
Q16: Find an exponential model for the
Q17: The size N , in thousands,
Q18: The formula for an exponential function
Q19: A radioactive substance is decaying exponentially with
Q20: Use exponential regression to determine what
Unlock this Answer For Free Now!
View this answer and more for free by performing one of the following actions

Scan the QR code to install the App and get 2 free unlocks

Unlock quizzes for free by uploading documents