The following table shows the weekly total sales (in dollars) at a small roadside vegetable stand for the months June through September. 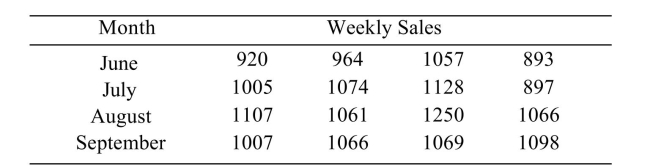 i). Construct an ANOVA table.
ii). Can you conclude that the weekly sales varies with the month? Use the level of significance.
Correct Answer:
Verified
\hl ...
View Answer
Unlock this answer now
Get Access to more Verified Answers free of charge
Q8: In a one-way ANOVA, the following data
Q9: One of the factors that determines
Q10: Samples were drawn from three populations.
Q11: Samples were drawn from three populations.
Q12: In a one-way ANOVA, the following data
Q14: Samples were drawn from three populations.
Q15: The following table shows the weekly
Q16: In a one-way ANOVA, the following data
Q17: In a one-way ANOVA, the following data
Q18: In a one-way ANOVA, the following data
Unlock this Answer For Free Now!
View this answer and more for free by performing one of the following actions

Scan the QR code to install the App and get 2 free unlocks

Unlock quizzes for free by uploading documents