The amounts 5 and 2 are compared. Which of the following graphical displays are the least misleading?
A) 
B) 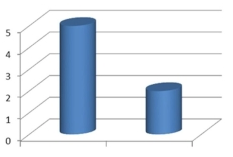
C) 
D) 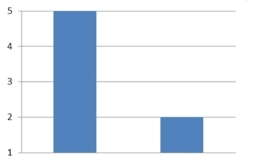
Correct Answer:
Verified
Q16: The following frequency distribution presents the
Q17: The following frequency distribution presents the
Q18: The following table presents the purchase
Q19: Thirty households were surveyed for the
Q20: Following is a pie chart that presents
Q22: A sample of 200 high school
Q23: Following are the numbers of Dean's
Q24: Construct a stem-and-leaf plot for the
Q25: Gravity on Mars: The gravity on Earth
Q26: Thirty households were surveyed for the
Unlock this Answer For Free Now!
View this answer and more for free by performing one of the following actions

Scan the QR code to install the App and get 2 free unlocks

Unlock quizzes for free by uploading documents