The following display from a graphing calculator presents the least-squares regression line for predicting the price of a certain commodity (y) from the price of a barrel of oil (x) . 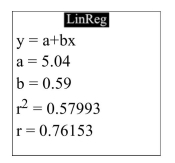 What is the correlation between the oil price and the commodity price?
A) 0.76153
B) 0.59
C) 5.04
D) 0.57993
Correct Answer:
Verified
Q19: The following table shows the per-person
Q20: One of the primary feeds for
Q21: The following MINITAB output presents the
Q22: An automotive engineer computed a least-squares
Q23: The following display from a graphing calculator
Q25: An automotive engineer computed a least-squares
Q26: As with many other construction materials,
Q27: For the following data set, how
Q28: For the following data set, compute
Q29: The following MINITAB output presents the
Unlock this Answer For Free Now!
View this answer and more for free by performing one of the following actions

Scan the QR code to install the App and get 2 free unlocks

Unlock quizzes for free by uploading documents