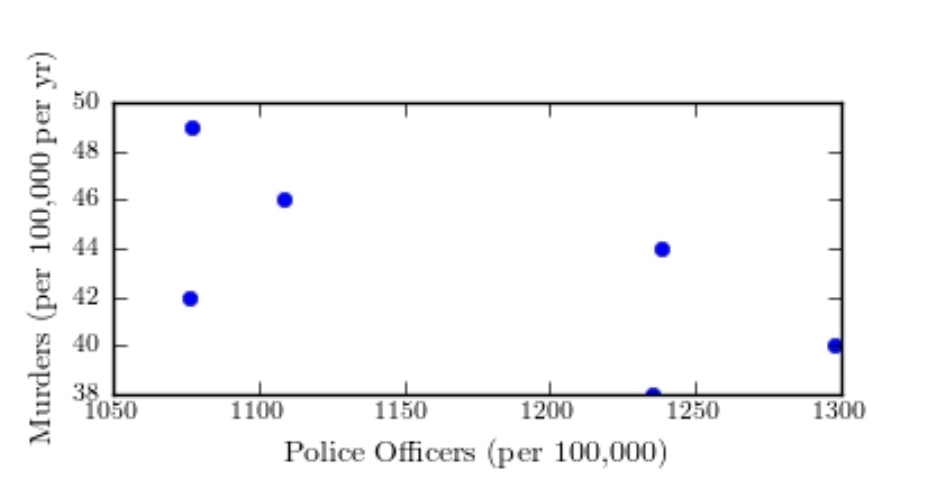
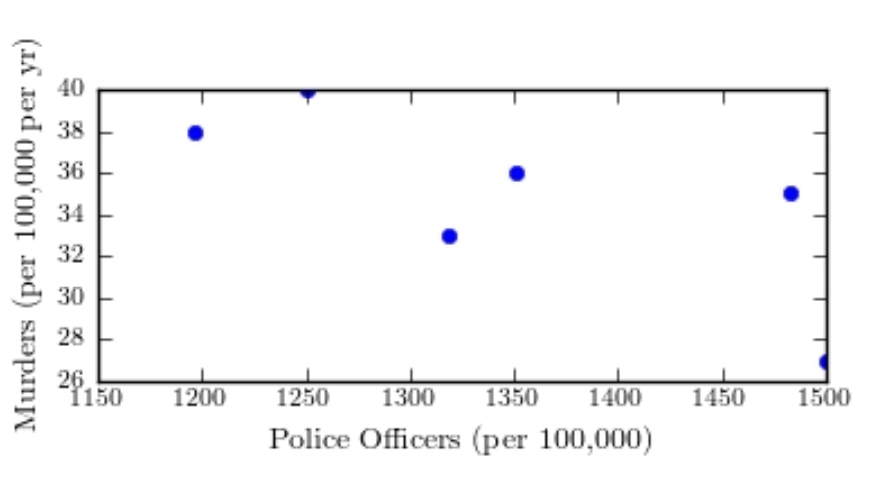
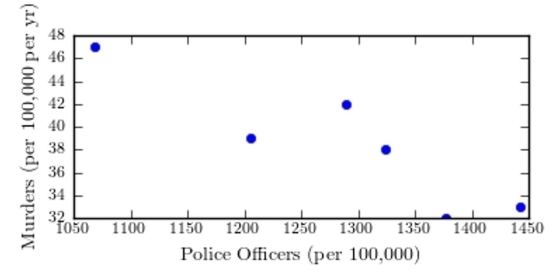
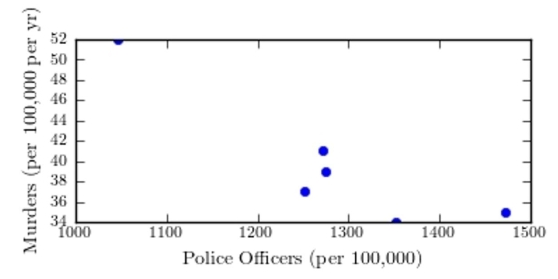
The following table presents the number of police officers (per 100,000 citizens) and the annual murder rate (per 100,000 citizens) for a sample of cities. Construct a scatter plot of the per capita murder rate (y) versus the per capita number of police officers(x) )
A) 
B) 
C) 
D) 
Correct Answer:
Verified
Q9: The following table presents the average
Q10: One of the primary feeds for
Q11: The common cricket can be used
Q12: The following table presents the number
Q13: The common cricket can be used
Q15: One of the primary feeds for
Q16: A blood pressure measurement consists of
Q17: The following table presents the number
Q18: Characterize the relationship shown in the figure.
Q19: The following table shows the per-person
Unlock this Answer For Free Now!
View this answer and more for free by performing one of the following actions

Scan the QR code to install the App and get 2 free unlocks

Unlock quizzes for free by uploading documents