The graph below shows the percentage of students enrolled in the College of Engineering at State University. Use
the graph to answer the question. 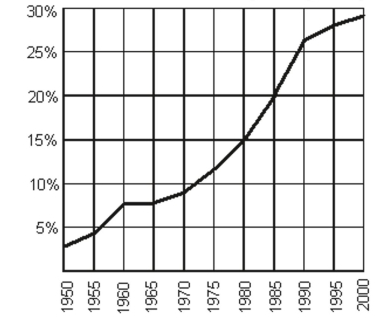
-If f(x) = 26%, what year is represented by x?
A) 1990
B) 1985
C) 1995
D) 1980
Correct Answer:
Verified
Q71: Identify the intercepts. Q72: Identify the intercepts. Q73: Use the graph to find the Q74: Use the graph to find the Q75: Use the Vertical Line Test to Identify Q77: Use the Vertical Line Test to Identify Q78: Use the Vertical Line Test to Identify Q79: Use the graph to find the Q80: The graph below shows the percentage Q81: Identify the intercepts. Unlock this Answer For Free Now! View this answer and more for free by performing one of the following actions Scan the QR code to install the App and get 2 free unlocks Unlock quizzes for free by uploading documents
-![]()
-![]()
-![]()

