Solve the problem.
-The bar graph below shows a company's yearly profits from 1991 to 1999. Let an represent the company's profit, in millions, in year n, where n=1 corresponds to 1991, n = 2 corresponds to 1992, and so on. 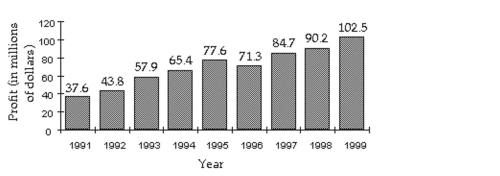
Find
A) million
B) million
C) million
D) million
Correct Answer:
Verified
Q37: Use Factorial Notation
Write the first four
Q38: Use Summation Notation Q39: Use Factorial Notation Q40: Use Factorial Notation Q41: Use Summation Notation Q43: Use Summation Notation Q44: Use Summation Notation Q45: Use Summation Notation Q46: Use Summation Notation Q47: Use Summation Notation Unlock this Answer For Free Now! View this answer and more for free by performing one of the following actions Scan the QR code to install the App and get 2 free unlocks Unlock quizzes for free by uploading documents
-
Write the first four
Write the first four
-
-
-
-
-
-

