The box-plot shown below was constructed from data regarding the annual salaries of both Opera
singers and Country Western singers. 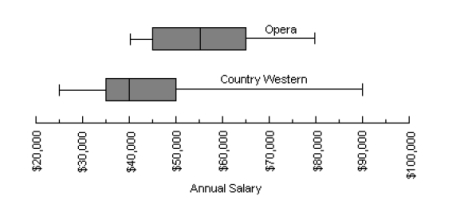 Based on the graph above, is there a larger proportion of Opera singers or a larger proportion of Country Western singers with a salary range above $50,000? Explain.
Correct Answer:
Verified
Si...
View Answer
Unlock this answer now
Get Access to more Verified Answers free of charge
Q13: You and several friends in your dorm
Q14: You and several friends in your dorm
Q15: The data shown below represents the annual
Q16: The histogram shown below gives the final
Q17: You and several friends in your dorm
Q19: The box-plot shown below was constructed from
Q20: Refer to the situation in problem 7;
Q21: The histogram shown below gives the heights
Q22: In order to qualify for the game
Q23: The pie-chart shown below gives the responses
Unlock this Answer For Free Now!
View this answer and more for free by performing one of the following actions

Scan the QR code to install the App and get 2 free unlocks

Unlock quizzes for free by uploading documents