The graph below is of a normal curve. The shaded portion of the graph represents 95 % of the total area under the curve. According to the graph, what is the value of the 16th percentile P16 ?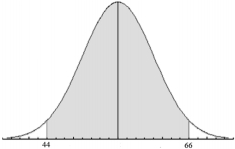
Correct Answer:
Verified
Q3: The amount of time that a student
Q4: The actual weight of the contents of
Q5: After finishing college, you start working as
Q6: After several weeks of compiling data you
Q7: The lung capacity of an Olympic swimmer
Q9: An honest coin is tossed a total
Q10: In a normal distribution with a standard
Q11: After several weeks of compiling data you
Q12: The battery life of an iPod has
Q13: The graph below is of a normal
Unlock this Answer For Free Now!
View this answer and more for free by performing one of the following actions

Scan the QR code to install the App and get 2 free unlocks

Unlock quizzes for free by uploading documents