Use a graphing calculator to plot the data and find the quadratic function of best fit.
-The following table shows the median number of hours of leisure time that Americans had each week in
various years. 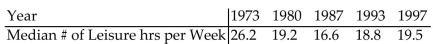
Use x = 0 to represent the year 1973. Using a graphing utility, determine the quadratic regression equation for
the data given. What year corresponds to the time when Americans had the least time to spend on leisure?
Correct Answer:
Verified
View Answer
Unlock this answer now
Get Access to more Verified Answers free of charge
Q179: Determine the quadratic function whose graph
Q180: Determine where the function is increasing
Q181: Determine the quadratic function whose graph is
Q182: Determine the quadratic function whose graph is
Q183: Find the complex zeros of the
Q185: Determine the quadratic function whose graph is
Q186: Determine the quadratic function whose graph is
Q187: Use a graphing calculator to plot
Q188: Use a graphing calculator to plot
Q189: Determine the quadratic function whose graph is
Unlock this Answer For Free Now!
View this answer and more for free by performing one of the following actions

Scan the QR code to install the App and get 2 free unlocks

Unlock quizzes for free by uploading documents