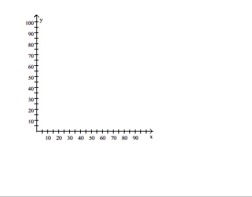
Plot and interpret the appropriate scatter diagram.
-The one-day temperatures for 12 world cities along with their latitudes are shown in the table below. Make a
scatter diagram for the data. Describe what happens to the one-day temperatures as the latitude increases. Latitude (degrees)  Temperature (F)°
Correct Answer:
Verified
View Answer
Unlock this answer now
Get Access to more Verified Answers free of charge
Q70: Use a graphing utility to find
Q71: Use a graphing utility to find
Q72: Use a graphing utility to find
Q73: Determine if the type of relation is
Q74: Determine if the type of relation is
Q76: Determine if the type of relation is
Q77: Solve the problem.
-The following scatter diagram shows
Q78: Use a graphing utility to find
Q79: Use a graphing utility to find
Q80: Use a graphing utility to find
Unlock this Answer For Free Now!
View this answer and more for free by performing one of the following actions

Scan the QR code to install the App and get 2 free unlocks

Unlock quizzes for free by uploading documents