A professor wants to know if the amount of time her students spent working on a statistics assignment relates to the grade the student receives. She surveyed 10 students and recorded the data below. Which of the following statements is most correct? 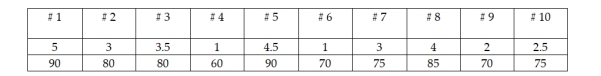
A) A histogram will illustrate whether a linear relationship exists between the number of hours studied and the grade received.
B) A scatter diagram would be useful for displaying a relationship between the number of hours studied and the grade received.
C) A line chart for these data will show a trend between the student number and the grade received.
D) None of the above
Correct Answer:
Verified
Q122: The sales manager at Western Furniture Company
Q123: Which of the following questions CANNOT be
Q124: A scatter diagram can be used to
Q125: Explain what information can be conveyed by
Q126: Why should a histogram contain no gaps
Q128: Suppose you are given the following data.
Q129: Assuming you have data for a variable
Q130: In creating a frequency distribution for numerical
Q131: Consider the following chart. Which of the
Q132: Suppose that you have a data set
Unlock this Answer For Free Now!
View this answer and more for free by performing one of the following actions

Scan the QR code to install the App and get 2 free unlocks

Unlock quizzes for free by uploading documents