The bar charts below depict the marital statuses of Americans, separated by gender. Which bar chart shows more variability in marital status? Why? 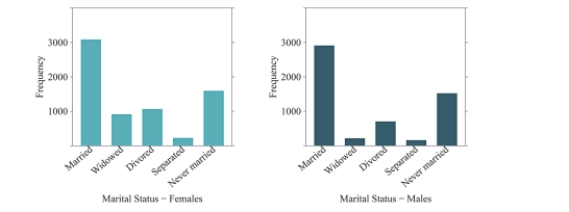
A) The female bar chart shows more variability because many of the observations fall into one category ("Married") .
B) The female bar chart shows more variability because there are more observations in the different categories than there are for males.
C) The male bar chart shows more variability because many of the observations fall into one category ("Married") .
D) The male bar chart shows more variability because there are more observations in the different categories than there are for females.
Correct Answer:
Verified
Q17: for following questions , what would you
Q18: Order the following histograms from least to
Q19: Using the following bar chart, what can
Q20: What is the difference between a bar
Q21: Which dotplot represents the same data as
Q23: When examining distributions of numerical data, what
Q24: The following histogram represents the movie runtimes
Q25: In the following histogram, what can you
Q26: for following questions , match one of
Q27: What does it mean to find the
Unlock this Answer For Free Now!
View this answer and more for free by performing one of the following actions

Scan the QR code to install the App and get 2 free unlocks

Unlock quizzes for free by uploading documents