The two histograms below display the exact same data. How do the plots differ? 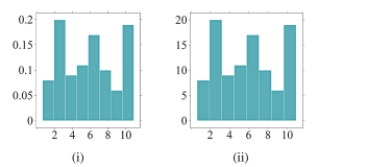
A) Histogram (i) uses frequencies to simply count the number of observations at a given value. Histogram (ii) uses relative frequencies to show the proportion of observations at a given value.
B) Histogram (i) uses relative frequencies to show the proportion of observations at a given value.Histogram (ii) uses frequencies to simply count the number of observations at a given
Value.
C) Histograms (i) and (ii) are exactly the same; there are no differences between the plots.
D) Histograms (i) and (ii) do not display the same data because the values listed on the y-axis do not match.
Correct Answer:
Verified
Q31: What information is NOT explicitly portrayed in
Q32: Use the following information to answer questions
Q33: What is the typical value for the
Q34: What is the difference between a bar
Q35: Use the following information to answer questions
Q37: Which statement below is NOT supported by
Q38: Order the following histograms from most to
Q39: for following questions , match one of
Q40: According to the word cloud, which is
Q41: Which histogram represents the same data as
Unlock this Answer For Free Now!
View this answer and more for free by performing one of the following actions

Scan the QR code to install the App and get 2 free unlocks

Unlock quizzes for free by uploading documents