If you were to create a dotplot to display the same data that is represented in the following histogram, how many dots would you draw to represent heights that fall between 1.5 meters and 1.6 meters? 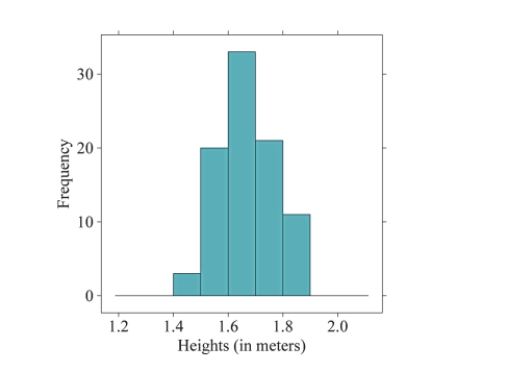
Correct Answer:
Verified
View Answer
Unlock this answer now
Get Access to more Verified Answers free of charge
Q4: Use the following information to answer questions
Q5: The two histograms below display the exact
Q6: Use the word cloud to answer questions
Q7: When examining distributions of numerical data, what
Q8: Use the following information to answer questions
Q10: for following questions , what would you
Q11: How is a dotplot similar to a
Q12: How would you describe the typical value
Q13: Below are two histograms. One corresponds to
Q14: Use the word cloud to answer questions
Unlock this Answer For Free Now!
View this answer and more for free by performing one of the following actions

Scan the QR code to install the App and get 2 free unlocks

Unlock quizzes for free by uploading documents