Use the following information to answer Questions .
The scatterplot below shows the relationship between a car's speed and the distance it traveled to come
to a complete stop when hitting the brakes. The correlation coefficient between the values is 0.81. 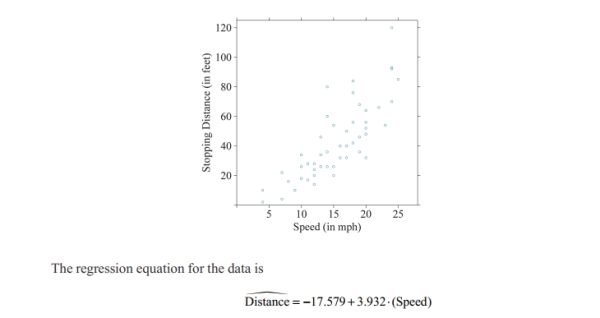
-Can we use the regression equation to predict the stopping distance of a car that is traveling at 40 mph?
A) No, we cannot make a prediction because a car that is traveling at 40 mph is outside the range of our data.We would be extrapolating.
B) No, we cannot make a prediction because the correlation coefficient does not equal 1.
C) Yes, we can always make predictions once we have a regression equation.
D) Yes, we can make a prediction because the scatterplot shows a strong positive linear relationship.
Correct Answer:
Verified
Q30: Use the following regression equation regarding car
Q31: Use the following information to answer Questions
Q32: Use the following information for following questions
Q33: Suppose the ages and heights of 100
Q34: Use the following information for following questions
Q36: Use the following regression equation regarding car
Q37: Which scatterplot below depicts a stronger linear
Q38: Suppose daily high and low temperature measures
Q39: A study about high school student SAT
Q40: Which of the following scatterplots shows data
Unlock this Answer For Free Now!
View this answer and more for free by performing one of the following actions

Scan the QR code to install the App and get 2 free unlocks

Unlock quizzes for free by uploading documents