Use the following information to answer Questions .
The scatterplot below shows the relationship between the average monthly temperature and the
monthly cost of a gas bill. The correlation coefficient between the values is −0.92. 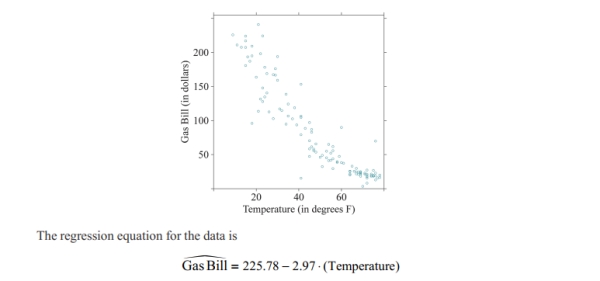
-If appropriate, calculate the expected gas bill cost for a month with an average temperature of −  . If it's not appropriate, explain why.
Correct Answer:
Verified
View Answer
Unlock this answer now
Get Access to more Verified Answers free of charge
Q15: Which scatterplot below depicts a stronger linear
Q16: Use the following information for following questions
Q17: Suppose the heights of teenagers were recorded
Q18: Suppose data were collected on neighborhoods about
Q19: Create a data set of 2 variables
Q21: Use the following information for following questions
Q22: Which of the following sets of numbers
Q23: Given the following scatterplot, if a point
Q24: Use the following regression equation regarding car
Q25: For any set of data, the regression
Unlock this Answer For Free Now!
View this answer and more for free by performing one of the following actions

Scan the QR code to install the App and get 2 free unlocks

Unlock quizzes for free by uploading documents