Use the following information to answer Questions .
The scatterplot below shows the relationship between the average monthly temperature and the
monthly cost of a gas bill. The correlation coefficient between the values is −0.92. 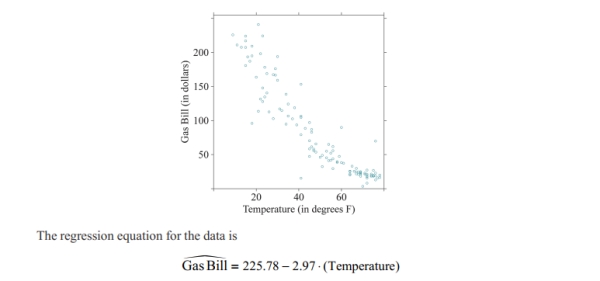
-Do lower monthly temperature cause gas bills to be more expensive? Explain your reasoning.
Correct Answer:
Verified
View Answer
Unlock this answer now
Get Access to more Verified Answers free of charge
Q2: Use the following regression equation regarding airline
Q3: Use the following regression equation regarding airline
Q4: Which of the following scatterplots shows data
Q5: For the following scatterplot, what effect would
Q6: Given the following scatterplot, if the point
Q8: A study about exercise routines reported that
Q9: Use the following information for following questions
Q10: When will a correlation coefficient be negative?
Q11: Use the following information for following questions
Q12: Use the following information for following questions
Unlock this Answer For Free Now!
View this answer and more for free by performing one of the following actions

Scan the QR code to install the App and get 2 free unlocks

Unlock quizzes for free by uploading documents