From the TI-84 graphing calculator screenshots below, there are specific shaded areas that represent p-values. Choose the statement that best describes the interpretation of these p-values. 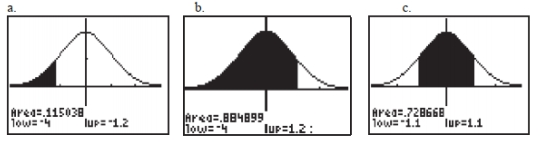
A) The p-values shown in graphics a and b display one-sided tests while c displays a shaded area showing a two-sided p-value.
B) The p-value shown in graphic c displays a one-sided test with a small p-value.
C) The p-value shown in graphic c displays a small two-sided p-value.
D) The p-value shown in graphic b displays a one-sided test with a small p-value.
Correct Answer:
Verified
Q38: [Objective: Understand the components of hypothesis testing]
Q39: A research firm carried out a hypothesis
Q40: Read the following then choose the appropriate
Q41: [Objective: Understand the p-value] From the TI-84
Q42: Use the following information to answer questions
Q44: [Objective: Test a hypothesis for a population
Q45: [Objective: Understand the components of hypothesis testing]
Q46: Use the following information to answer questions
Q47: Use the following information to answer questions
Q48: A polling agency is interested in testing
Unlock this Answer For Free Now!
View this answer and more for free by performing one of the following actions

Scan the QR code to install the App and get 2 free unlocks

Unlock quizzes for free by uploading documents