The line graph shows the recorded hourly temperatures in degrees Fahrenheit at an airport. 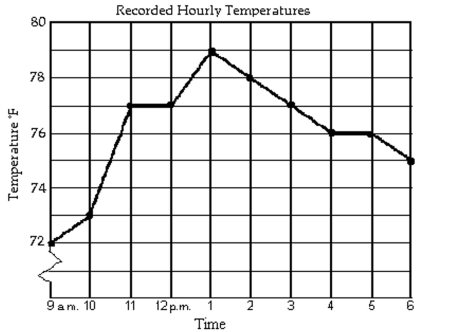
-During which two hour period did the temperature increase the most?
A) 10 a.m. to 12 p.m.
B) 9 a.m. to 11 a.m.
C) 12 p.m. to 2 p.m.
D) 10 a.m. to 11 a.m.
Correct Answer:
Verified
Q171: For which values of x is Y1
Q172: Solve the problem.
-Mark started out by walking
Q173: Match the story with the correct figure.
-The
Q174: Solve the equation. Q175: Match the story with the correct figure. Q176: The line graph shows the recorded hourly Q177: Match the correct viewing rectangle dimensions with Q178: Match the correct viewing rectangle dimensions Q179: At which points do the graph of Q181: Solve the equation.
-
-The
--4 = 4(x - 9)
Unlock this Answer For Free Now!
View this answer and more for free by performing one of the following actions

Scan the QR code to install the App and get 2 free unlocks

Unlock quizzes for free by uploading documents