The line graph shows the recorded hourly temperatures in degrees Fahrenheit at an airport. 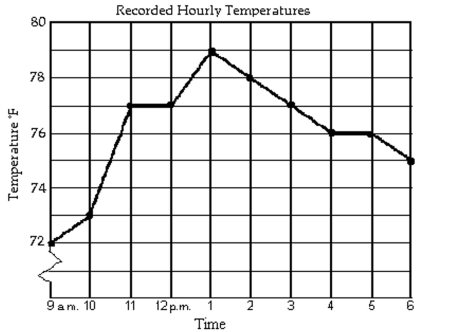
-At what time was the temperature the highest?
A) 11 a.m.
B) 2 p.m.
C) 5 p.m.
D) 1 p.m.
Correct Answer:
Verified
Q147: Graph the equation. Q148: Plot the point in the rectangular coordinate Q149: Graph the equation. Q150: Simplify the algebraic expression. Q151: Graph the equation. Q153: Graph the equation. Q154: Plot the point in the rectangular coordinate Q155: Graph the equation. Q156: Simplify the algebraic expression. Q157: Graph the equation. Unlock this Answer For Free Now! View this answer and more for free by performing one of the following actions Scan the QR code to install the App and get 2 free unlocks Unlock quizzes for free by uploading documents
-![]()
-![]()
-
-![]()
-![]()
-
-
-![]()

