Draw Stem-and-Leaf Plots
-For the stem-and-leaf plot below, what are the maximum and minimum entries 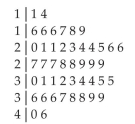
A) min: 11
B) max: 38; min: 7
C)
D) max: 40 ; min: 11
Correct Answer:
Verified
Q18: The sum of all the relative frequencies
Q19: Use the graph to answer the question.
Q20: The results of a survey about
Q21: The pie chart shows the percentage
Q22: Construct Histograms of Continuous Data
-
Q24: Construct Histograms of Continuous Data
-The 30
Q25: The pie chart shows the percentage
Q26: The pie chart shows the percentage
Q26: The class width is the difference between
A)
Q28: Construct Histograms of Continuous Data
-A sample
Unlock this Answer For Free Now!
View this answer and more for free by performing one of the following actions

Scan the QR code to install the App and get 2 free unlocks

Unlock quizzes for free by uploading documents