The scatter diagram shows the relationship between average number of years of education and births per woman ofchild bearing age in selected countries. Use the scatter plot to determine whether the statement is true or false.
-There is a strong positive correlation between years of education and births per woman. 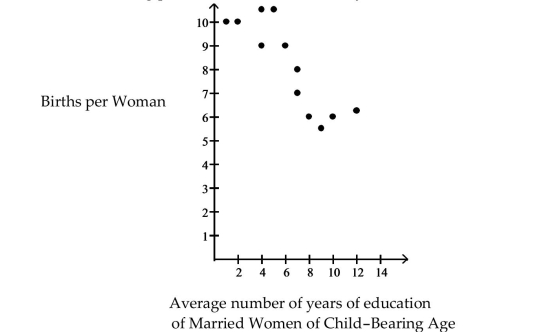
A) False
B) True
Correct Answer:
Verified
Q1: Write the word or phrase that
Q2: Choose the one alternative that best
Q4: Write the word or phrase that
Q5: Write the word or phrase that
Q6: Use the scatter diagrams shown, labeled
Q7: Write the word or phrase that
Q8: Choose the one alternative that best
Q9: Write the word or phrase that
Q10: Write the word or phrase that
Q11: Use the scatter diagrams shown, labeled
Unlock this Answer For Free Now!
View this answer and more for free by performing one of the following actions

Scan the QR code to install the App and get 2 free unlocks

Unlock quizzes for free by uploading documents