Graph the equation.
-For the following table of data, a. Draw a scatterplot.
B. Calculate the correlation coefficient.
C. Calculate the least squares line and graph it on the scatterplot.
D. Predict the y-value when x is 20. 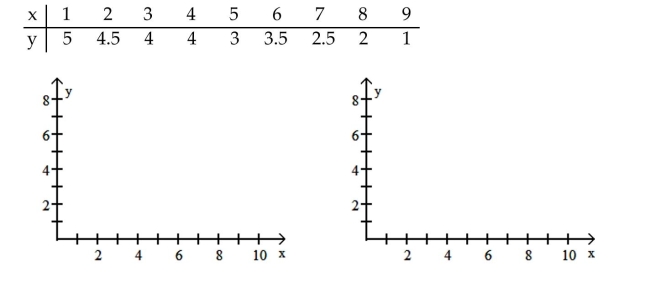
A) 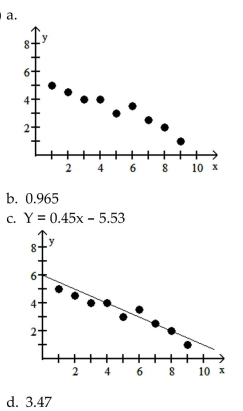
B) 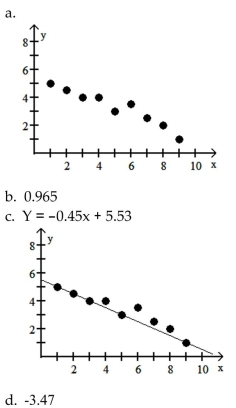
C) 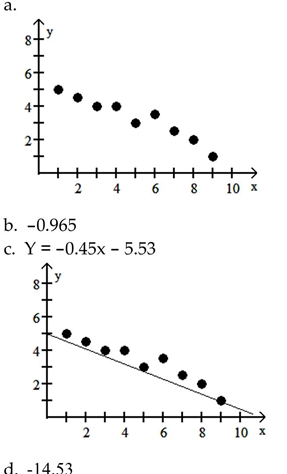
D) 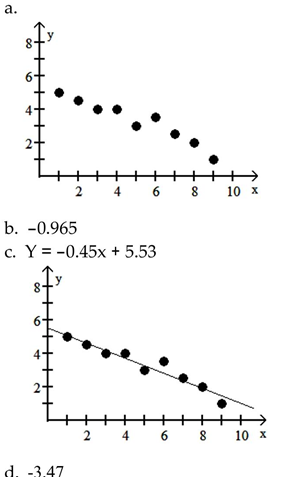
Correct Answer:
Verified
Q79: Find the slope of the line.
-A
Q80: In the table below, x represents
Q81: Solve the problem.
-Suppose the function y =
Q82: Solve the problem.
-Ten students in a
Q83: Find an equation in slope-intercept form (where
Q85: Find the slope of the line.
Q86: Find an equation in slope-intercept form
Q87: Find the slope of the line
Q88: Solve the problem.
-A meteorologist in the Upper
Q89: Find the equation of the least
Unlock this Answer For Free Now!
View this answer and more for free by performing one of the following actions

Scan the QR code to install the App and get 2 free unlocks

Unlock quizzes for free by uploading documents