Multiple Choice
FIGURE 2-5 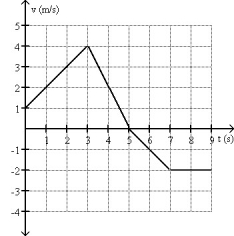
-A plot of position as a function of time is shown in Fig. 2-5. Which graph represents the acceleration as a function of time?
A) 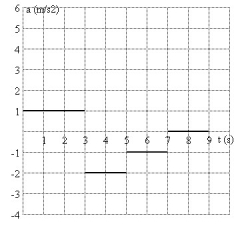
B) 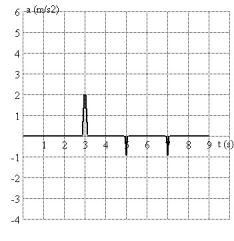
C) 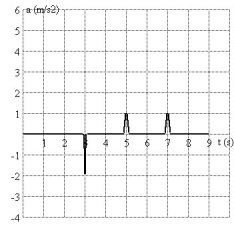
D) 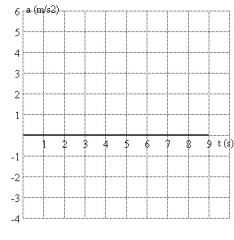
E) 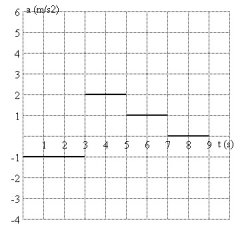
Correct Answer:
Verified
Related Questions
Q22: The slope of a line connecting two
Q23: If the velocity versus time graph of
Q29: Can an object have increasing speed while
Q30: Can an object's velocity change direction when
Unlock this Answer For Free Now!
View this answer and more for free by performing one of the following actions

Scan the QR code to install the App and get 2 free unlocks

Unlock quizzes for free by uploading documents