FIGURE 7-5 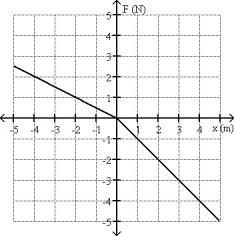
-The graph of a force as a function of position is shown in Fig. 7-5. Determine the amount of work done by this force for an object during a displacement from x = -2.00 m to x = 2.00 m.
A) -12.00 J
B) -3.00 J
C) -1.00 J
D) 12.00 J
E) 3.00 J
Correct Answer:
Verified
Q22: How much energy is needed to change
Q42: FIGURE 7-4 Q45: FIGURE 7-3 Q46: A 30 N-force toward the west is Q48: FIGURE 7-3 Q49: FIGURE 7-3 Q50: Which of the following vectors is perpendicular Q51: The angle between vector Q52: The scalar product of vector Q73: If the work done to stretch a Unlock this Answer For Free Now! View this answer and more for free by performing one of the following actions Scan the QR code to install the App and get 2 free unlocks Unlock quizzes for free by uploading documents![]()
![]()
![]()
![]()
![]()


