The following data represent the number of cars passing through a toll booth during a certain time period over a number of days.
Which of these choices display the correct dotplot?
A) Number of Cars Passing Through
a Toll Booth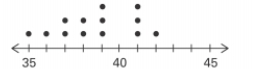
B) Number of Cars Passing Through
a Toll Booth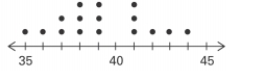
C) Number of Cars Passing Through a Toll Booth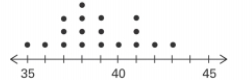
D) Number of Cars Passing Through a Toll Booth 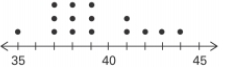
Correct Answer:
Verified
Q26: According to USA Today, the largest categories
Q28: Smoking and the episodes of lung cancer
Q31: The frequency distribution below summarizes the
Q33: The frequency distribution below summarizes the
Q35: Attendance records at a school show
Q37: The following frequency distribution displays the
Q38: The following frequency distribution depicts the
Q39: The following data consists of the
Q40: A nurse measured the blood pressure of
Q41: In a survey, 20 people were
Unlock this Answer For Free Now!
View this answer and more for free by performing one of the following actions

Scan the QR code to install the App and get 2 free unlocks

Unlock quizzes for free by uploading documents