The histogram below represents the number of television sets per household for a sample of U.S. households. What is the sample size? 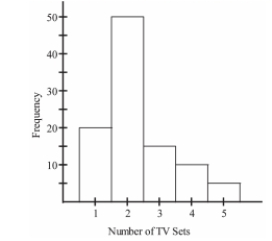
A) 100 households
B) 5 households
C) 50 households
D) 90 households
Correct Answer:
Verified
Q5: The weights (in pounds)of 22 members
Q6: Identify the cumulative frequency distribution that
Q7: Which of the following cumulative frequency
Q8: The frequency distribution below summarizes employee
Q9: Analysis of the data from 25
Q11: A store manager counts the number
Q12: The following frequency distribution represents the
Q13: The scatterplot below displays the amount of
Q14: A nurse measured the blood pressure of
Q15: The attendance counts for this season's
Unlock this Answer For Free Now!
View this answer and more for free by performing one of the following actions

Scan the QR code to install the App and get 2 free unlocks

Unlock quizzes for free by uploading documents