The following scatterplot shows the percentage of the vote a candidate received in the 2004 senatorial elections according to the voter's income level based on an exit poll of voters
Conducted by CNN. The income levels 1 -8 correspond to the following income classes: Use the election scatterplot to the find the critical values corresponding to a significance level used to test the null hypothesis of .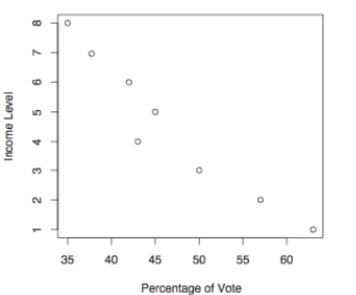
A) and
B)
C) and
D)
Correct Answer:
Verified
Q44: Which of the following terms is sometimes
Q50: Find the ranks corresponding to the ages
Q51: What is the corresponding parametric test for
Q59: Do parametric or nonparametric tests have higher
Q103: Match the nonparametric test with its
Q103: Use the sign test to test the
Q108: A rank correlation coefficient is to be
Q110: Use the runs test to determine
Q111: Use a Kruskal-Wallis test to test
Q112: Use the Minitab display to test
Unlock this Answer For Free Now!
View this answer and more for free by performing one of the following actions

Scan the QR code to install the App and get 2 free unlocks

Unlock quizzes for free by uploading documents