The following scatterplot shows the percentage of the vote a candidate received in the 2004 senatorial elections according to the voter's income level based on an exit poll of voters
Conducted by CNN. The income levels 1 -8 correspond to the following income classes: Under -
150, or more.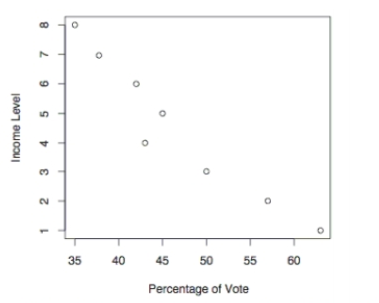
Use the election scatterplot to determine whether there is a correlation between percentage of vote and income level at the significance level with a null hypothesis of .
A) The test statistic is between the critical values, so we fail to reject the null hypothesis. There is no evidence to support a claim of correlation between percentage of vote and income level.
B) The test statistic is not between the critical values, so we fail to reject the null hypothesis. There is no evidence to support a claim of correlation between percentage of vote and income level.
C) The test statistic is between the critical values, so we reject the null hypothesis. There is sufficient evidence to support a claim of correlation between percentage of vote and income level.
D) The test statistic is not between the critical values, so we reject the null hypothesis. There is sufficient evidence to support a claim of correlation between percentage of vote and income level.
Correct Answer:
Verified
Q21: Provide the appropriate response. Describe the Wilcoxon
Q51: What is the corresponding parametric test for
Q59: Do parametric or nonparametric tests have higher
Q94: A teacher uses two different CAI
Q95: Use the Wilcoxon rank-sum approach to
Q97: Use the Wilcoxon signed -ranks test
Q98: Use a Kruskal-Wallis test to test
Q100: Match the parametric test with its
Q101: Find the critical value. Assume that
Q103: Match the nonparametric test with its
Unlock this Answer For Free Now!
View this answer and more for free by performing one of the following actions

Scan the QR code to install the App and get 2 free unlocks

Unlock quizzes for free by uploading documents