A control chart for is shown below. Determine whether the process mean is within statistical control. If it is not, identify which of the three out-of-control criteria lead to rejection of a statistically stable mean.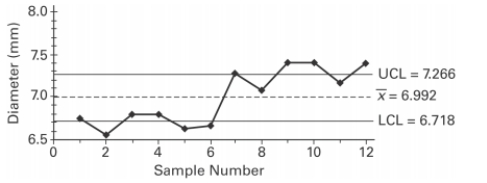
Correct Answer:
Verified
View Answer
Unlock this answer now
Get Access to more Verified Answers free of charge
Q1: Examine the given run chart or control
Q2: A common goal of quality control is
Q3: A control chart for R is shown
Q4: Examine the given run chart or control
Q6: Use the given process data to
Q7: Use the given process data to
Q8: Construct an R chart and determine
Q8: Are control charts based on actual behavior
Q11: Examine the given run chart or control
Q12: Describe an R chart and give an
Unlock this Answer For Free Now!
View this answer and more for free by performing one of the following actions

Scan the QR code to install the App and get 2 free unlocks

Unlock quizzes for free by uploading documents