Use the data to create a stemplot.
-A car dealer is deciding what kinds of vehicles he should order from the factory. He looks at his sales report for the preceding period. Choose the vertical scale so that the relative frequencies are represented.
Construct a Pareto chart to help him decide.
A) 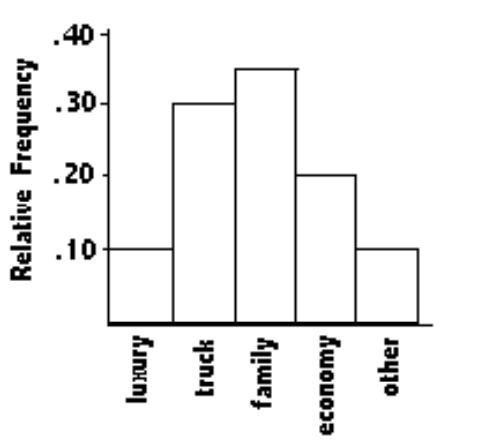
B) 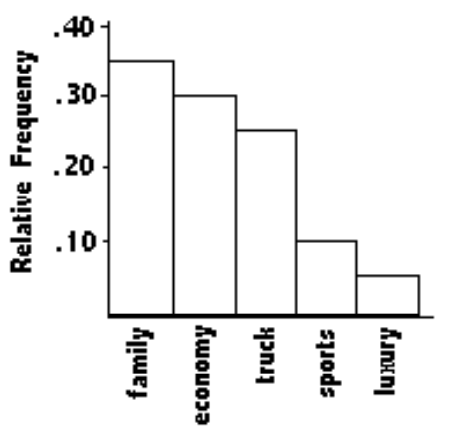
C) 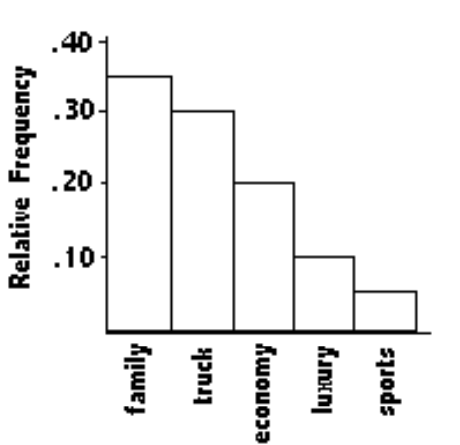
D) 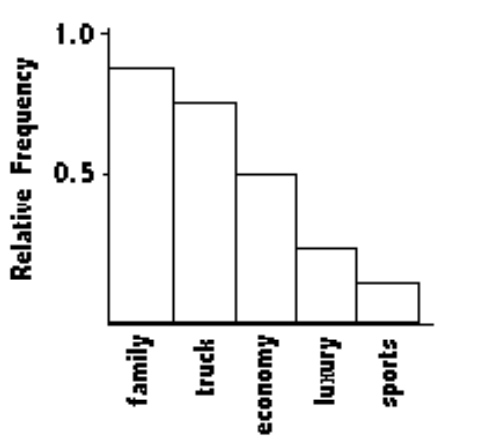
Correct Answer:
Verified
Q61: Solve the problem.
-The Kappa Iota Sigma Fraternity
Q62: Solve the problem.
-At the National Criminologists
Q63: Construct a pie chart representing the
Q64: Construct the dot plot for the
Q65: Construct the dot plot for the
Q67: Construct a pie chart representing the
Q68: Construct the dot plot for the
Q69: Construct a pie chart representing the
Q70: Construct the dot plot for the
Q71: Use the data to create a
Unlock this Answer For Free Now!
View this answer and more for free by performing one of the following actions

Scan the QR code to install the App and get 2 free unlocks

Unlock quizzes for free by uploading documents