The scatterplot below shows the number of alcoholic drinks consumed and memory testresults for some college students. Is there an association?
If so, describe the pattern. Be sureto comment on trend, shape, and the strength of the association.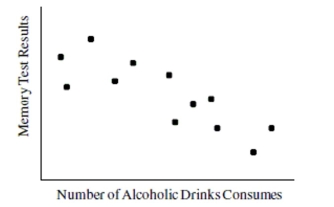
Correct Answer:
Verified
View Answer
Unlock this answer now
Get Access to more Verified Answers free of charge
Q41: The following regression equation was found to
Q43: Suppose that environmentalists monitor algae levels in
Q44: Use the following information to answer the
Q48: Based on the scatterplots below, what is
Q49: The figures below show the relationship between
Q50: Use the regression equation to predict how
Q51: A horticulturist conducted an experiment on 120
Q51: The following regression equation was found to
Q58: Suppose that runner height (in inches)and finish
Q60: Use the data provided in the table
Unlock this Answer For Free Now!
View this answer and more for free by performing one of the following actions

Scan the QR code to install the App and get 2 free unlocks

Unlock quizzes for free by uploading documents