Test identification Suppose you were asked to analyze each of the situations described below.
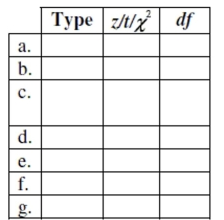
(NOTE: Do not do these problems!) For each, indicate which procedure you would use (pick the appropriate number from the list), the test statistic ( , , or "chi-squared"), and, if or , the number of degrees of freedom. A choice may be used more than once.
1. proportion sample
2. difference of proportions samples
3. mean - 1 sample
4. difference of means - independent samples
5. mean of differences - matched pairs
6. goodness of fit
7. homogeneity
8. independence
a. Which takes less time to travel to work-car or train? We select a random sample of 45
businessmen, observe them commuting using both methods, and compare their travel
times.
b. A college professor wonders if two versions (A and
B) of his exam are equally difficult.
He randomly mixes 20 Version A's and 20 Version B's together and passes them out to his
40 students. After grading the exams, he compares the scores for the two versions.
c. Forty people complaining of allergies take an antihistamine. They report that their
discomfort subsided in an average of 18 minutes; the standard deviation was 4 minutes.
The manufacturer wants a 95% confidence interval for the "relief time".
d. A health professional selected a random sample of 100 patients from each of four major
hospital emergency rooms to see if the major reasons for emergency room visits are similar
in all four major hospitals. The major reason categories are accident, illegal activity, illness,
or other.
e. A policeman believes that about 40% of older drivers speed on highways, but a
confidential survey found that 49 of 88 randomly selected older drivers admitted speeding
on highways at least once. Is this strong evidence that the policeman was wrong?
f. According to United Nations Population Division, the age distribution of the
Commonwealth of Australia is: 21% less than 15 years of age, 67% between 15 and 65 years
of age, and 12% are over 65 years old. A random sample of 210 residents of Canberra
revealed 40 were less than 15 years of age, 145 were between 15 and 65 years of age, and 25
were over 65 years old. Is Canberra unusual in any way?
g. Among a random sample of college-age students, 6% of the 473 men said they had been
adopted, compared to only 4% of the 552 women. Does this indicate a significant difference
between adoption rates of males and females in college-age students?
Correct Answer:
Verified
Q6: Peanut M&Ms According to the Mars Candy
Q264: Trainers need to estimate the level of
Q265: An elementary school principal wants to know
Q266: Autos Hoping to improve the gas mileage
Q267: The two samples whose statistics are
Q268: Based on data from two very
Q270: Auto repairs An insurance company hopes
Q271: AP Grading Every year Educational Testing
Q273: Packing Line A packing company investigates hiring
Q274: Doctors at a technology research facility
Unlock this Answer For Free Now!
View this answer and more for free by performing one of the following actions

Scan the QR code to install the App and get 2 free unlocks

Unlock quizzes for free by uploading documents