Of the 23 first year male students at State U. admitted from Jim Thorpe High School, 8 were offered baseball scholarships and 7 were offered football scholarships. The University admissions committee looked at the students' composite ACT scores (shown in table), wondering if the University was lowering their standards for athletes. Assuming that this group of students is representative of all admitted students, what do you think?
Boxplots:
Normal Probability Plot: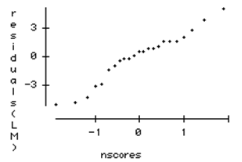
-Test an appropriate hypothesis and state your conclusion
Correct Answer:
Verified
View Answer
Unlock this answer now
Get Access to more Verified Answers free of charge
Q13: A college admissions counselor was interested
Q14: As part of a survey, students
Q15: Carnivores A random sample of some
Q16: Voter registration A random sample of
Q17: In the study "The Role of
Q19: Several volunteers engage in a special exercise
Q20: Wingspan A person's wingspan is the
Q21: a. H0: There is no association between
Q22: A San Jose State student collects
Q23: How many degrees of freedom are there
Unlock this Answer For Free Now!
View this answer and more for free by performing one of the following actions

Scan the QR code to install the App and get 2 free unlocks

Unlock quizzes for free by uploading documents