It is possible that the distance that a city is from the ocean could affect its average January
low temperature. Coast gives an approximate distance of each city from the East Coast or
West Coast (whichever is nearer). Including it in the regression yields the following
regression table: Dependent variable is:JanTemp
R squared R squared (adjusted) with degrees of freedom
And here is a scatterplot of the residuals: 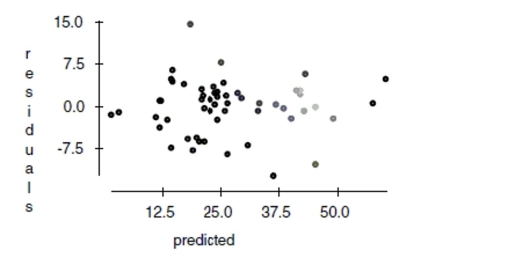
Correct Answer:
Verified
View Answer
Unlock this answer now
Get Access to more Verified Answers free of charge
Q18: Of the 23 first year male
Q20: The regression below predicts the daily
Q32: Of the 23 first year male
Q162: Engineers want to know what factors
Q163: Here is the regression with both
Q164: Here is a partial regression plot for
Q166: For a class project, students tested
Q169: Shrimp From 1982 to 1990, there
Q170: If the diameter is increased from 4
Q171: Here is the corresponding regression table:
Unlock this Answer For Free Now!
View this answer and more for free by performing one of the following actions

Scan the QR code to install the App and get 2 free unlocks

Unlock quizzes for free by uploading documents