The bigger the stop sign, the more expensive it is. Here is a graph of the height of a sign in inches versus its cost in dollars.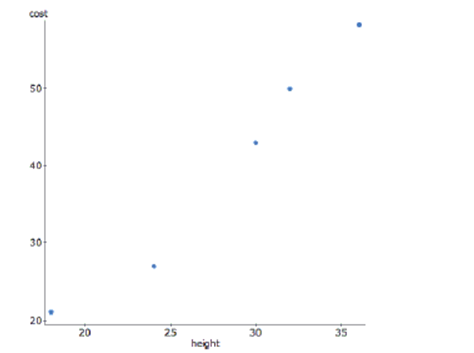
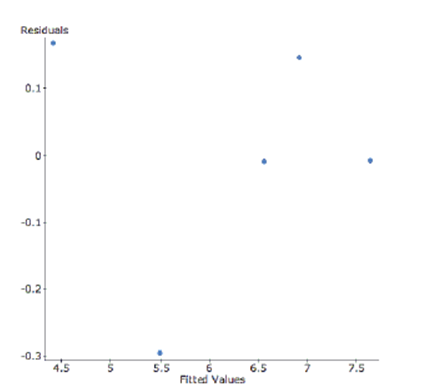
To achieve linearity, the data was transformed using a square root function of cost. Here are the results and a residual plot.Dependent Variable: sqrt(cost)
(correlation coefficient)
s: 0.2141
-Write the transformed regression equation. Make sure to define any variables used in your equation.
Correct Answer:
Verified
View Answer
Unlock this answer now
Get Access to more Verified Answers free of charge
Q6: Interpret the intercept of your model in
Q17: Interpret the slope of your model in
Q17: Interpret the slope of your model in
Q108: The average movie ticket prices in
Q109: During a science lab, students heated
Q111: Personal debt According to The World
Q113: Halloween is a fun night. It
Q114: Associations For each pair of variables, indicate
Q116: Storks Data show that there is a
Q117: A study examined the number of
Unlock this Answer For Free Now!
View this answer and more for free by performing one of the following actions

Scan the QR code to install the App and get 2 free unlocks

Unlock quizzes for free by uploading documents