Which is true of the data shown in the histogram? 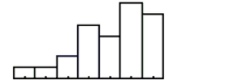 I. The distribution is skewed to the right.
II) The mean is probably smaller than the median.
III) We should use median and IQR to summarize these data.
A) I, II, and III
B) II only
C) I only
D) III only
E) II and III
Correct Answer:
Verified
Q19: The standard deviation of the data displayed
Q20: Which of the following summaries are changed
Q21: The SPCA has kept these data records
Q22: Which is true of the data whose
Q23: The SPCA collects the following data about
Q25: The best estimate of the standard deviation
Q26: Last weekend police ticketed 18 men whose
Q27: The five-number summary of credit hours
Q28: Suppose that a Normal model described student
Q29: Suppose that a Normal model describes the
Unlock this Answer For Free Now!
View this answer and more for free by performing one of the following actions

Scan the QR code to install the App and get 2 free unlocks

Unlock quizzes for free by uploading documents