The following scatterplot shows the percentage of the vote a candidate received in the 2004 senatorial elections according to the voter's income level based on an exit poll of voters conducted by CNN. The income levels 1-8 correspond to the following income classes: Under ; or more.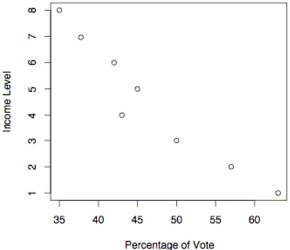
-Use the election scatterplot to the find the value of the rank correlation coefficient .
A)
B)
C)
D)
Correct Answer:
Verified
Q45: Use the rank correlation coefficient to
Q46: The following scatterplot shows the percentage
Q47: Is the data point, P, an outlier,
Q48: The following scatterplot shows the percentage
Q49: Two different tests are designed to
Q51: Construct a scatterplot for the given
Q52: For the data below, determine the
Q53: Find the value of the linear
Q54: Given the linear correlation coefficient r
Q55: For which of the following sets of
Unlock this Answer For Free Now!
View this answer and more for free by performing one of the following actions

Scan the QR code to install the App and get 2 free unlocks

Unlock quizzes for free by uploading documents