A parcel delivery service lowered its prices and finds that it has delivered twice as many parcels this year as it did last year. To illustrate this fact, the manager draws a graph as shown below. Each cube depicts a parcel. The side length of the "parcel" on the right is twice the side length of the "parcel" on the left. Why is this graph misleading? What visual impression is created by the graph? 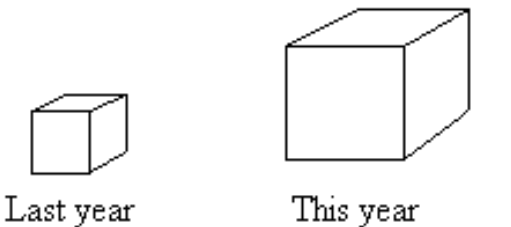
Correct Answer:
Verified
View Answer
Unlock this answer now
Get Access to more Verified Answers free of charge
Q1: Construct one table that includes relative
Q2: Use the given data to construct
Q3: Use the high closing values of
Q3: Provide an appropriate response.
-Suppose you are comparing
Q5: Using a strict interpretation of the
Q7: A medical research team studied the
Q8: The data shows the roundtrip mileage
Q10: In a survey, 20 people were
Q11: A college student wants to purchase one
Q59: Explain in your own words why a
Unlock this Answer For Free Now!
View this answer and more for free by performing one of the following actions

Scan the QR code to install the App and get 2 free unlocks

Unlock quizzes for free by uploading documents