Find the indicated z score. The graph depicts the standard normal distribution with mean 0 and standard deviation 1.
-Shaded area is 0.0901. 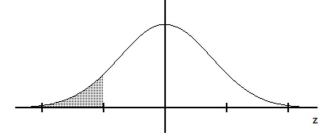
A)
B)
C)
D)
Correct Answer:
Verified
Q158: A study of the amount of time
Q159: The Precision Scientific Instrument Company manufactures
Q160: Assume that X has a normal
Q161: In a certain population, 11% of people
Q162: The serum cholesterol levels for men in
Q164: Use the normal distribution to approximate the
Q165: If selecting samples of si
Q166: Find the area of the shaded region.
Q167: Find the indicated z score. The graph
Q168: A final exam in Math 160 has
Unlock this Answer For Free Now!
View this answer and more for free by performing one of the following actions

Scan the QR code to install the App and get 2 free unlocks

Unlock quizzes for free by uploading documents