Find the area of the shaded region. The graph depicts the standard normal distribution with mean 0 and standard deviation 1.
-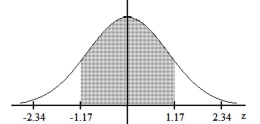
A) 0.8790
B) 0.1210
C) 0.7580
D) 0.2420
Correct Answer:
Verified
Q150: The given values are discrete. Use the
Q151: Estimate the indicated probability by using the
Q152: The scores on a certain test are
Q153: The distribution of certain test scores
Q154: The lengths of human pregnancies are normally
Q156: Using the following uniform density curve, answer
Q157: Scores on an English test are normally
Q158: A study of the amount of time
Q159: The Precision Scientific Instrument Company manufactures
Q160: Assume that X has a normal
Unlock this Answer For Free Now!
View this answer and more for free by performing one of the following actions

Scan the QR code to install the App and get 2 free unlocks

Unlock quizzes for free by uploading documents