Find the area of the shaded region. The graph depicts IQ scores of adults, and those scores are normally distributed with a mean of 100 and a standard deviation of 15 (as on the Wechsler test) . 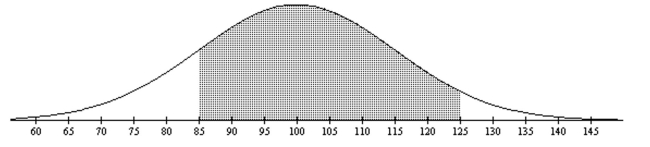
A) 0.7303
B) 0.7619
C) 0.7938
D) 0.7745
Correct Answer:
Verified
Q83: The Precision Scientific Instrument Company manufactures
Q84: Find the indicated z score. The graph
Q85: If z is a standard normal
Q86: Scores on a test have a
Q87: Computers are often used to randomly generate
Q89: Use the normal distribution to approximate the
Q90: Use the normal distribution to approximate the
Q91: A math teacher gives two different tests
Q92: Assume that the weight loss for
Q93: Find the indicated z score. The
Unlock this Answer For Free Now!
View this answer and more for free by performing one of the following actions

Scan the QR code to install the App and get 2 free unlocks

Unlock quizzes for free by uploading documents