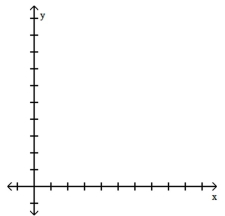
Construct a normal quartile plot of the given data. Use your plot to determine whether the data come from a normally distributed population.
-The systolic blood pressure (in mmHg) is given below for a sample of 12 men aged between 60 and 65.

Correct Answer:
Verified
Because the points lie rough...
View Answer
Unlock this answer now
Get Access to more Verified Answers free of charge
Q11: Provide an appropriate response.
-Under what conditions can
Q19: Provide an appropriate response.
-Under what conditions are
Q60: Three randomly selected households are surveyed as
Q62: A study of the amount of time
Q64: The Precision Scientific Instrument Company manufactures
Q65: In one region, the September energy consumption
Q67: Use the normal distribution to approximate the
Q68: Assume that z scores are normally distributed
Q131: Solve the problem. Round to the nearest
Q196: Solve the problem.
-After constructing a new manufacturing
Unlock this Answer For Free Now!
View this answer and more for free by performing one of the following actions

Scan the QR code to install the App and get 2 free unlocks

Unlock quizzes for free by uploading documents