Multiple Choice
The following frequency distribution presents the frequency of passenger vehicles that pa: through a certain intersection from 8:00 AM to 9:00 AM on a particular day.
Construct a relative frequency bar graph for the data.
A) 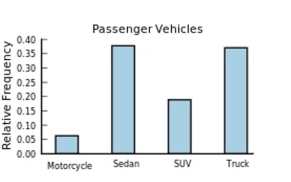
B) 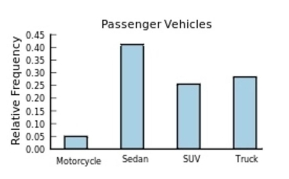
C) 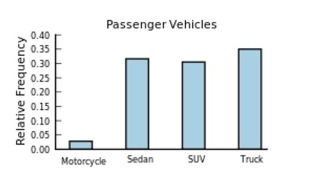
D) 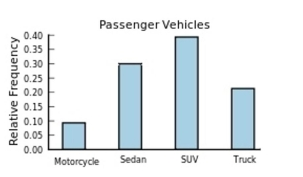
Correct Answer:
Verified
Related Questions
Q58: The following table presents the purchase
Q59: Which of the following is a histogram?
A)
Q60: If the graph of a frequency distribution
Q61: A sample of 200 high school
Unlock this Answer For Free Now!
View this answer and more for free by performing one of the following actions

Scan the QR code to install the App and get 2 free unlocks

Unlock quizzes for free by uploading documents