Solve the problem.
-Data regarding the amount spent by a government department is represented in the following graph. Find the rate of change of the amount spent with respect to time, in billions per year. 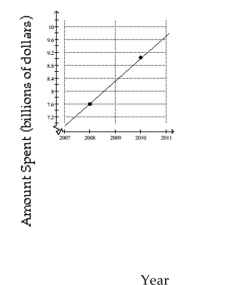
A) Increase of billion per year
B) Decrease of billion per year
C) Decrease of billion per year
D) Increase of billion per year
Correct Answer:
Verified
Q109: Solve the problem.
-Over one particular stretch of
Q110: Provide an appropriate response.
-The ordered pair (0,
Q111: Find the slope of the line
Q112: Solve the problem.
-Kannanaski Rapids drops 57 ft
Q113: Find the slope of the line going
Q115: Solve the problem.
-The value of a particular
Q116: Find the slope of the line.
-
Q117: Find the slope of the line.
-
Q118: Solve the problem. Q119: Provide an appropriate response.
-![]()
-The y-coordinate is positive
Unlock this Answer For Free Now!
View this answer and more for free by performing one of the following actions

Scan the QR code to install the App and get 2 free unlocks

Unlock quizzes for free by uploading documents