The graph below shows the number of students enrolled in various courses at State University in spring 2000. Each bar
represents a different course, and the height of the bar represents the number of students enrolled. Use the graph to
answer the question. 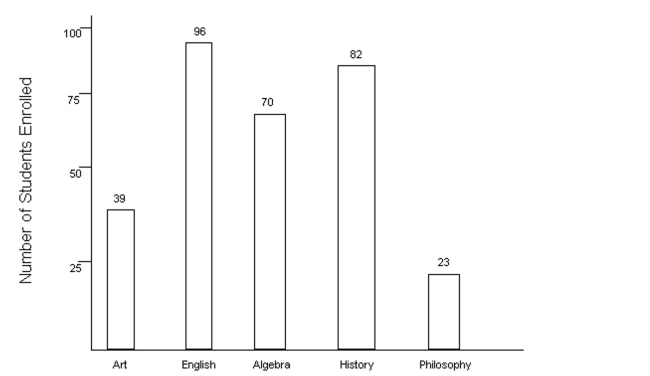
-Write an inequality statement using or comparing the number of students enrolled in Art and Philosophy.
A)
B)
C)
D)
Correct Answer:
Verified
Q87: Write the fraction in lowest terms.
-
Q88: The graph below shows the number of
Q89: Write the fraction in lowest terms.
-
Q90: Write the fraction in lowest terms.
-
Q91: Write the number as a product
Q93: Write the fraction in lowest terms.
-
Q94: Write the fraction in lowest terms.
-
Q95: Insert <, >, or = to make
Q96: Insert <, >, or = to
Q97: Write the number as a product
Unlock this Answer For Free Now!
View this answer and more for free by performing one of the following actions

Scan the QR code to install the App and get 2 free unlocks

Unlock quizzes for free by uploading documents